

Know where every asset is, how much it's used, and what idle equipment is costing you
Lyna ASSETS gives you a digital twin of your plant or yard: every machine, forklift, generator, or piece of heavy equipment located in real time on a map. Measure each asset's real utilization, get alerts when something leaves its zone, and put a number on the opportunity cost of what's underused.
78%
Utilization
22% underused · higher is better
318 / 320
Assets located
live
$12.4k
Opportunity cost
from underused assets
5h 20m
Time in zone
Asset 12 · Zone D
The platform
Your assets, live in the platform
The ASSETS module: every asset located in real time, how much it's used, and the cost of what sits idle.
No location · idle equipment · invisible cost
Expensive equipment sitting idle is your quietest cost
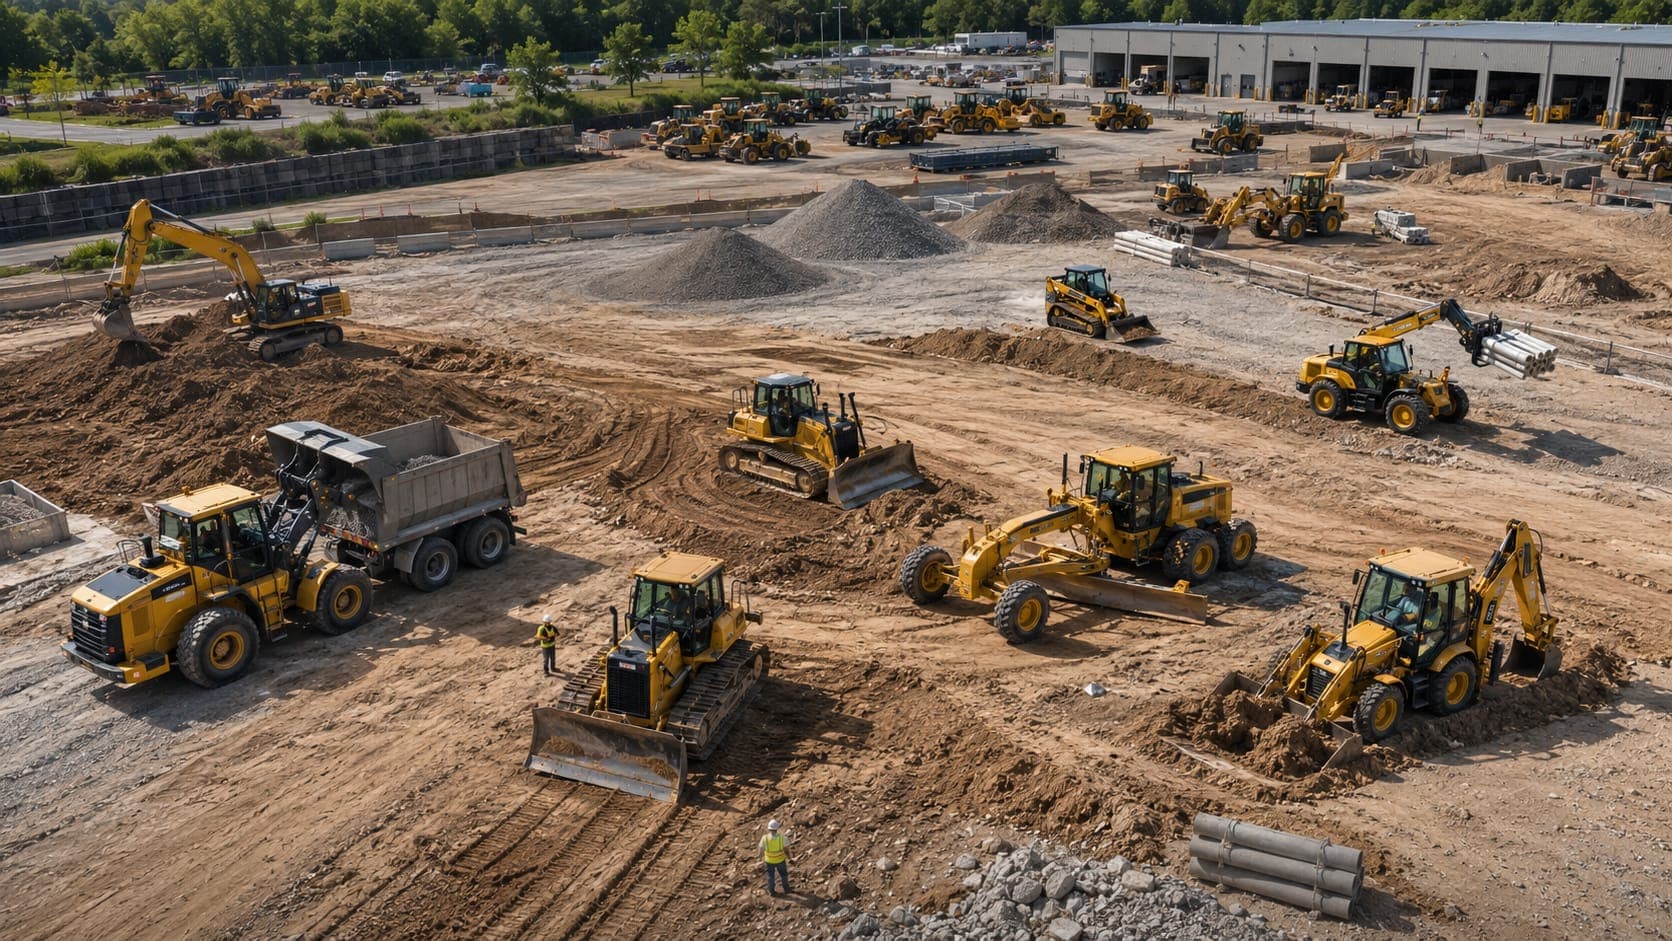
When you don't know where each asset is or how much it's actually used, you end up over-renting, hunting for machinery you already owned, or leaving costly equipment parked in a corner of the yard. The hours lost searching, the underused assets, and the uneven wear pile up without anyone measuring them. With no real-time visibility, you decide on estimates, and the opportunity cost of idle equipment never shows up in any report.
Capabilities that squeeze every asset
Location digital twin
A schematic map of your plant or yard with zones, geofences, and a pin for every asset, updated in real time. See where everything is at a glance, without walking the site.
Utilization per asset
Measure how much each machine, cobot, excavator, or generator is really used. Tell what's working from what's idle and prioritize where to act first.
Time per zone
Know how long each asset spends in every zone (Sector A, Zone 1, Yard 10) to spot stranded equipment, bottlenecks, and unnecessary moves.
Zone-exit alerts
Get an instant notification when an asset leaves the zone where it should be, so you can react before it becomes a loss or a risk.
Opportunity cost in dollars
The system translates underutilization into money: how much idle equipment is costing you, so you can justify rentals, reassignments, or write-offs with data, not hunches.
Occupancy by zone and hour
A heatmap reveals which zones and hours concentrate activity, so you can balance your assets' load and make better use of every space.
You squeeze every asset, prevent losses, and know exactly what idle equipment costs.
Stop operating blind: monitor, understand and decide in real time.
78%
Utilization · 22% underused
How we work
Assessment and zone mapping
We map your plant or yard, define zones and geofences, and prioritize critical assets to size the solution and the expected return.
Asset identification
We equip every relevant asset to report its location automatically, so no one has to log anything by hand.
Rules and thresholds
We configure allowed zones, exit alerts, and utilization targets to match your real operation, plus a reference cost for each type of equipment.
Go-live and training
We connect the digital twin, train your team, and leave the platform running from day one.
Where it has the greatest impact
Heavy equipment yards
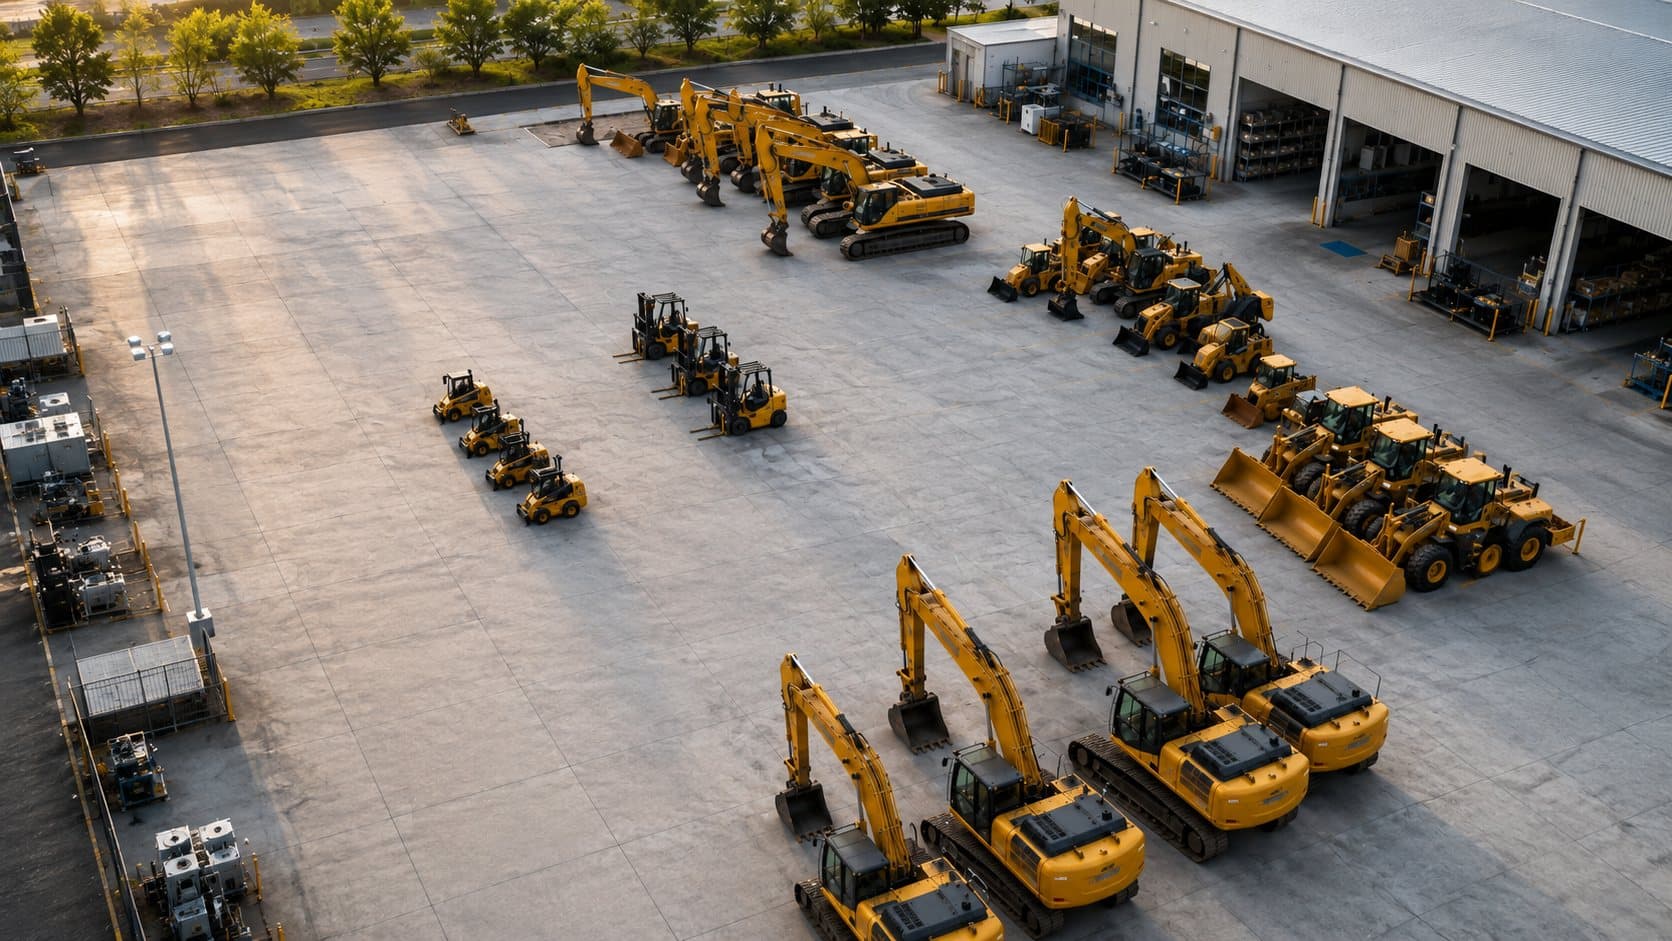
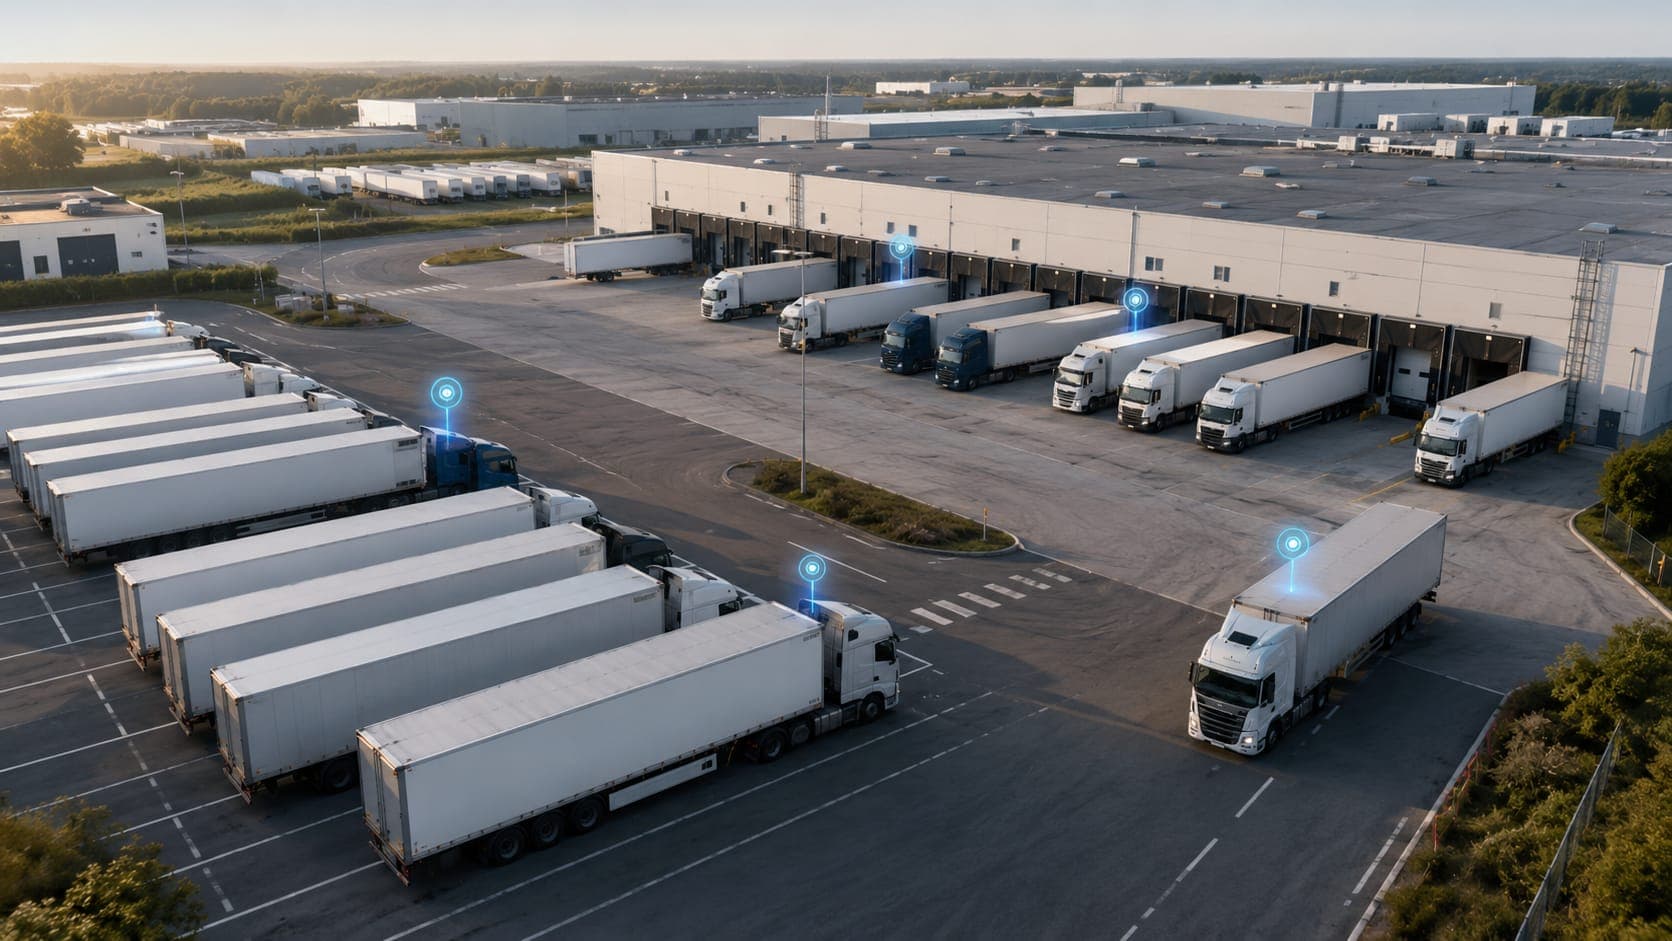
Excavators, generators, and high-value machinery located in real time, with utilization control to decide what to rent, move, or retire.
Manufacturing plants
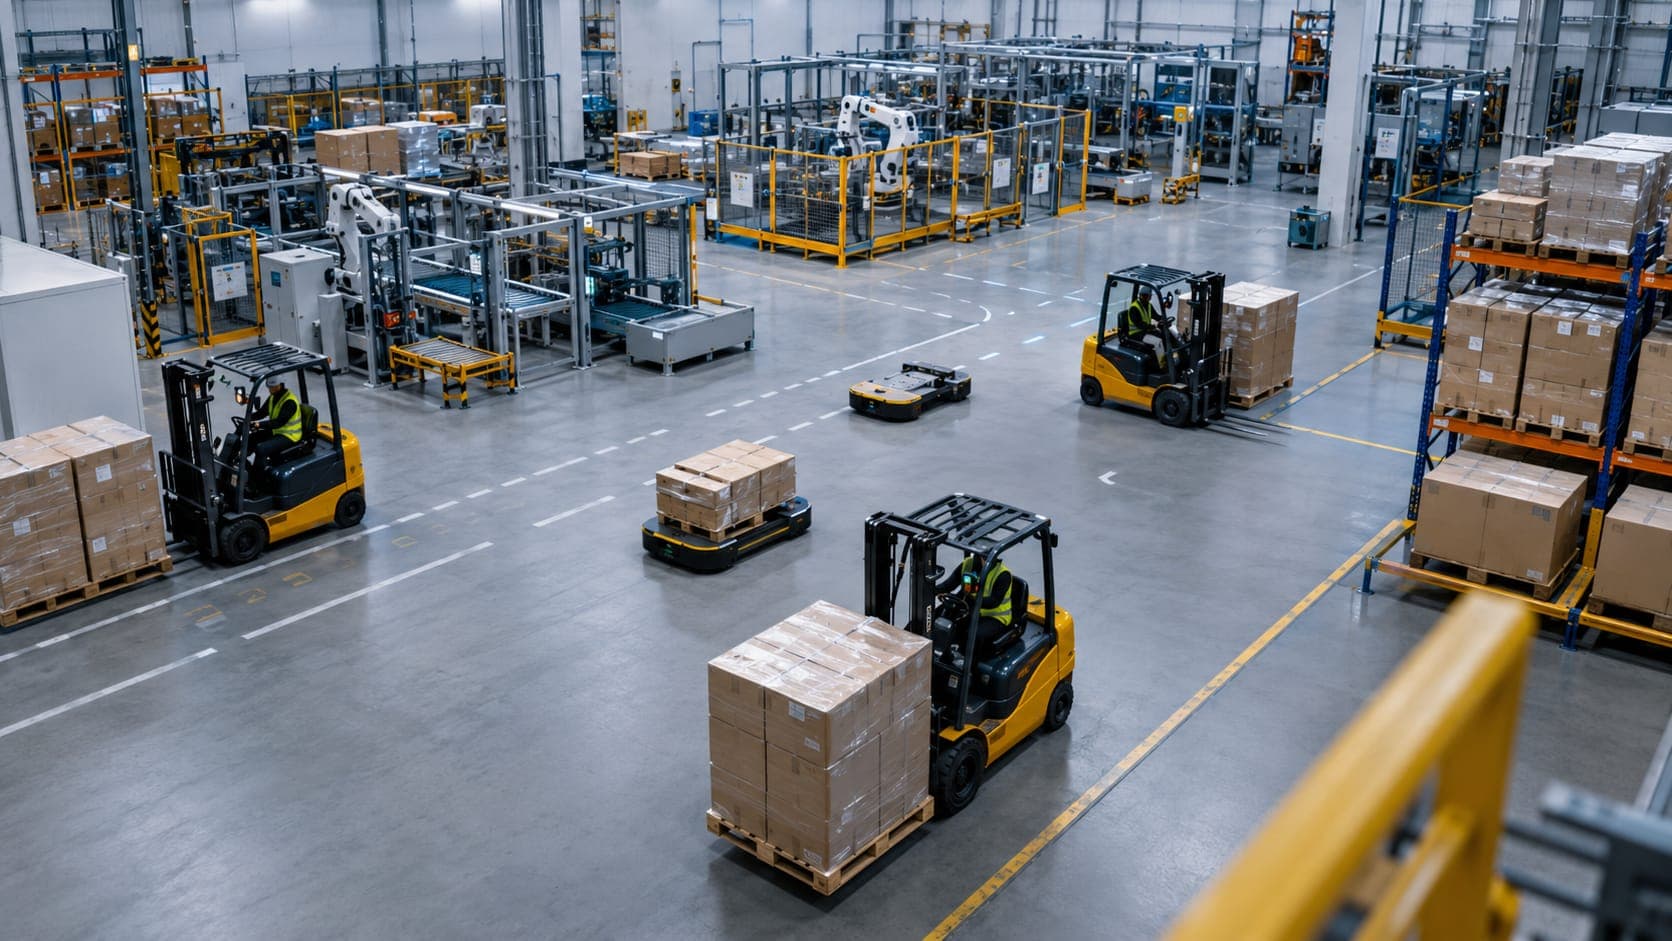
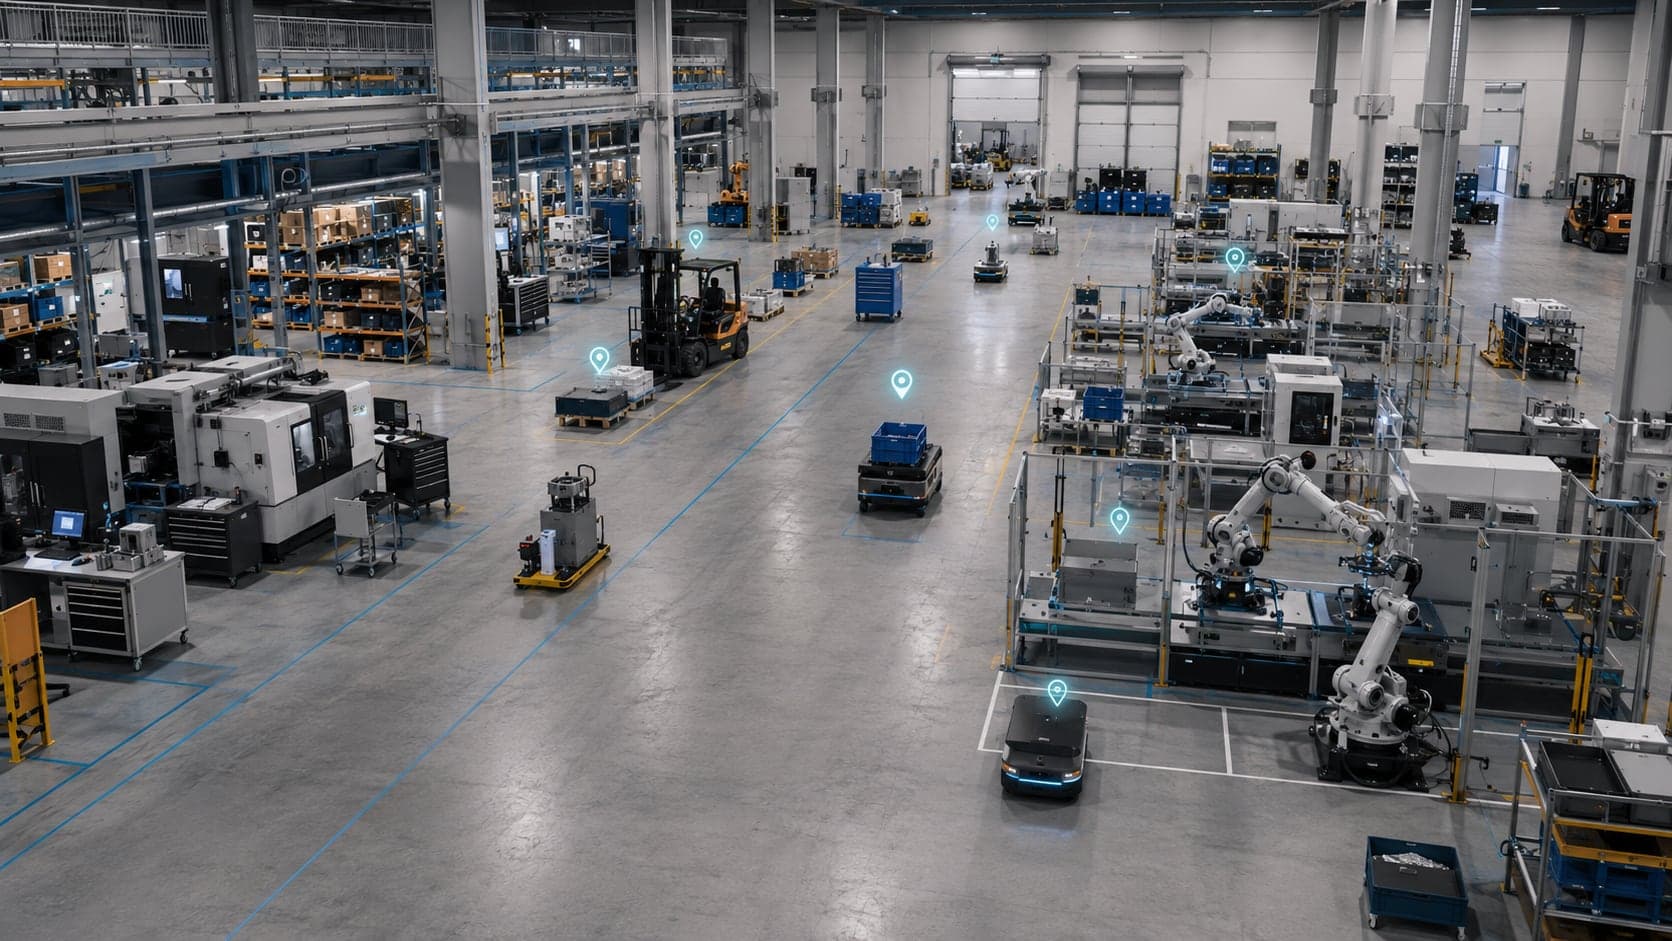
Forklifts, cobots, and mobile equipment located instantly, with time-per-zone and utilization to squeeze every asset on the floor.
Construction and infrastructure
Equipment spread across a site or between work fronts, with visibility of where each machine is and alerts when it leaves its assigned zone.
Equipment rental and internal fleets
Per-asset utilization control to maximize usage, cut unnecessary rentals, and back investment decisions with data.
FAQ
Frequently asked questions
It's a system that shows where each asset is in real time on a map of your plant or yard and also measures how much it's used. The AI layer turns that data into what matters: which equipment is underused, how much it's costing you, and which assets left their zone, so you decide with information instead of estimates.
It's a schematic replica of your facility (plant or yard) with its zones and geofences, where each asset appears as a pin that moves in real time. It lets you see your whole operation at a glance from a screen, without physically walking the site.
The system automatically records when an asset is operating versus idle, and how long it spends in each zone. From that it calculates a utilization percentage per asset and distinguishes what's used, underused, and inactive, with no manual entry.
You define the zones and geofences that matter for your operation, and the system sends an instant notification when an asset crosses outside the zone where it should be, so you can react in time to a deviation or a potential risk.
Yes. The solution works both in open yards with heavy equipment and in manufacturing plants with mobile equipment. Zones, geofences, and assets are configured to fit your facility, whether indoor, outdoor, or both.
Keep learning
Stop paying for equipment that sits idle
Request a free assessment and put a number on what your idle equipment is really costing you.