
Zone presence that drives productive time, not surveillance
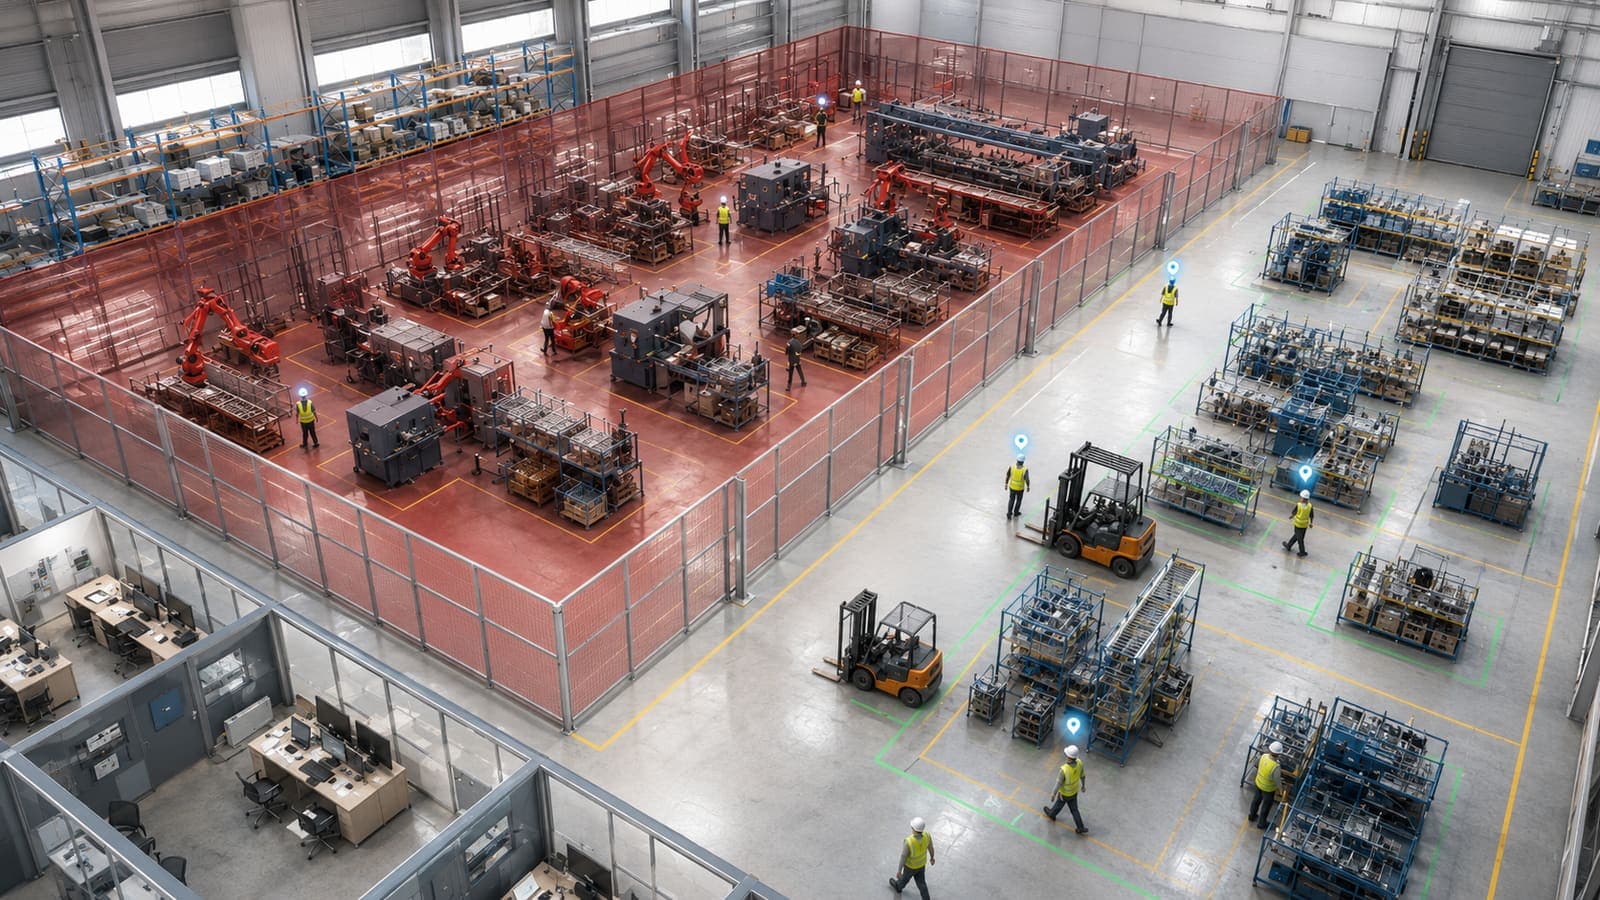
Lyna PRESENCE shows you how much of the time your workforce is where it creates value and lets the system alert only when a rule breaks: capacity exceeded or someone in a restricted zone. A live map of the human operation that adds safety, compliance and efficiency, with no one having to watch by hand.
86%
Time in productive areas
hero KPI · higher is better
3
Active shifts
no incidents
2
Active alerts
restricted area · capacity
Live
Zone map
workforce digital twin
The platform
Your human operation, live in the platform
The PRESENCE module: how much time staff spend where value is created, alerting only when a rule breaks.
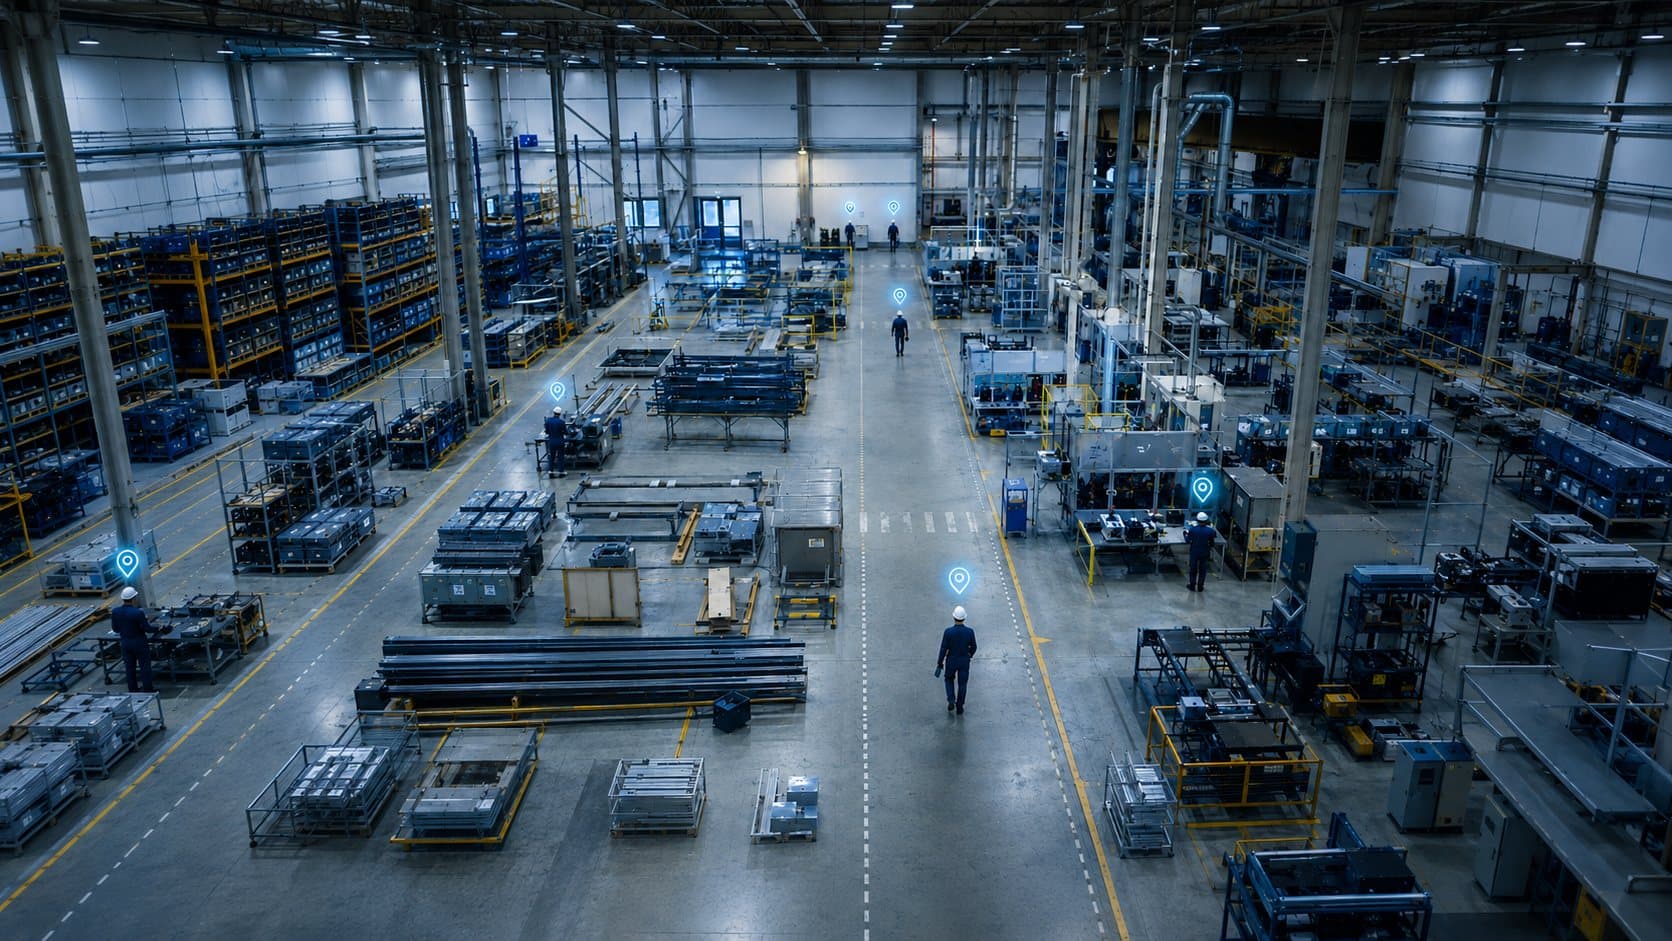
Manual logs · no area breakdown · capacity by eye
Without presence data, productive time slips out of view
In an operation with several areas and shifts, it's nearly impossible to know, cleanly and paperless, how much of the time people are where they create value versus in transit or support zones. Manual logs arrive late and don't tell areas apart, capacity compliance depends on someone watching, and when someone enters a restricted zone it's rarely known in time. The result is productive time that dissolves, safety risks that go unnoticed, and audits rebuilt by hand.
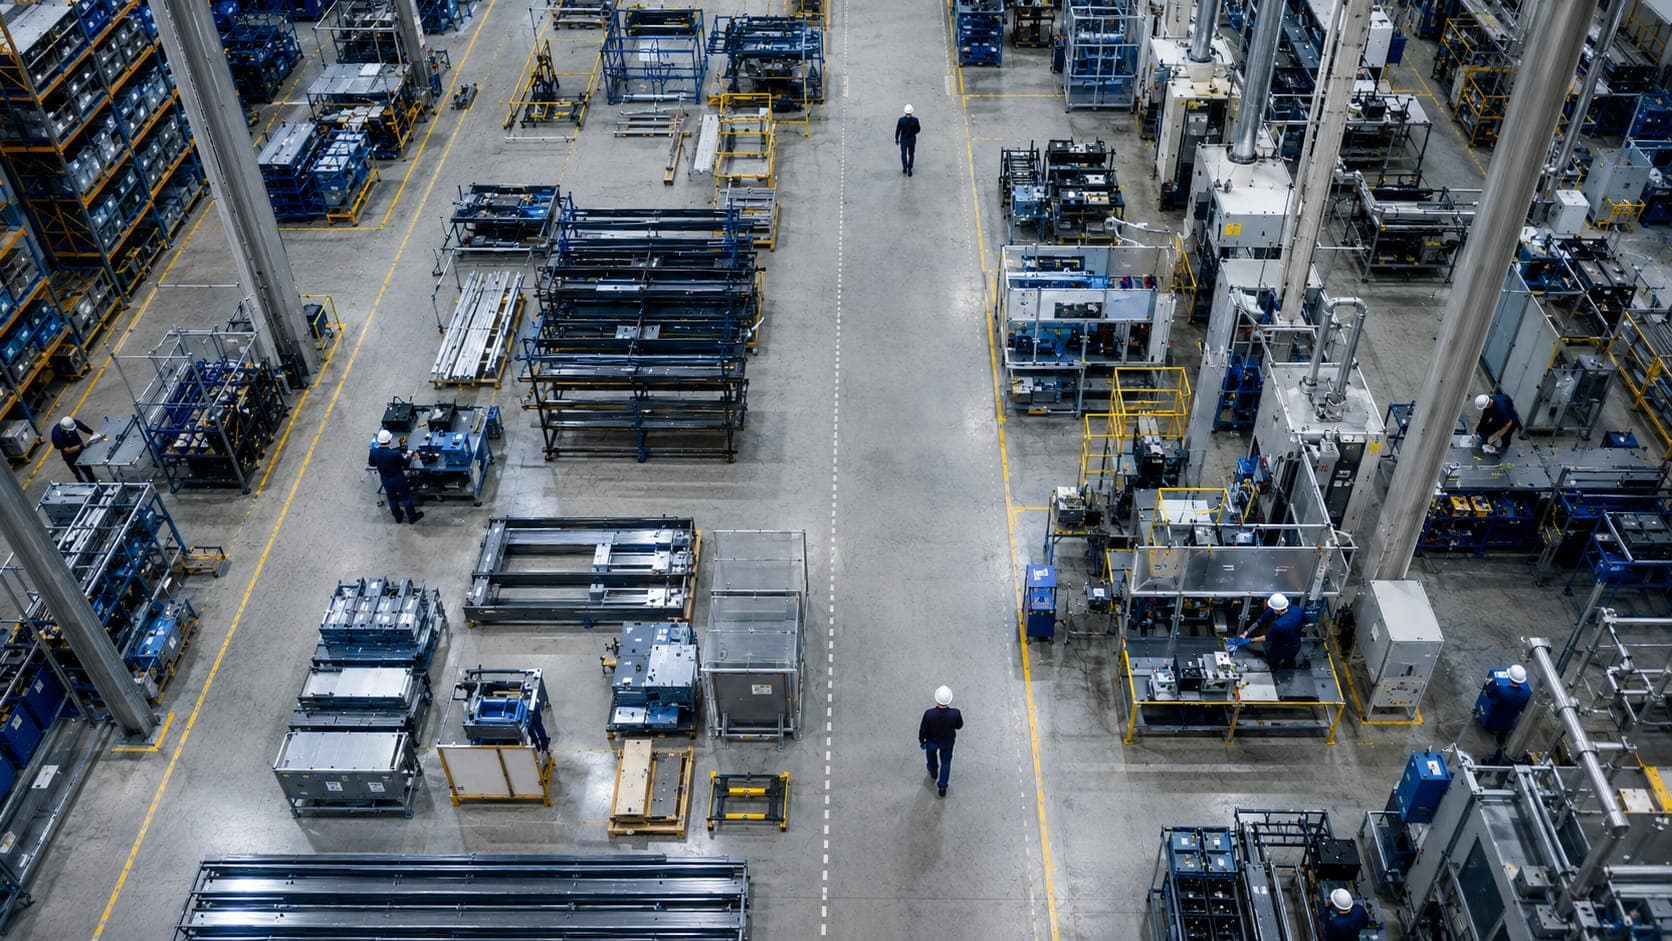
Capabilities that bring order to your team's presence
Time distribution by area
A 100% stacked bar shows how the shift's time splits across Entrance, Area 1, Lab, Production and Offices, with proportion and color by zone. At a glance you see where value concentrates.
% in productive areas
The hero indicator sums up, without pointing at anyone, how well the human operation flows: how much of the time is spent in the zones where value is created.
Zone path across the shift
A timeline shows movement through each area over the shift, to understand the real flow of the operation and spot bottlenecks between zones.
Rules and alerts by zone
You set maximum capacity and restricted zones per area, and the system alerts only when a rule breaks. No noise: attention arrives only when something matters.
Presence map by zone and hour
A zone-by-hour heatmap reveals where and when people concentrate, to plan capacity, safety and staffing based on real patterns.
Workforce digital twin
Presence shows as a live map with generic area labels, no personal names. You see the human operation as a floor plan, not a watch list.
More productive time, compliance and safety, with no manual watching.
Stop operating blind: monitor, understand and decide in real time.
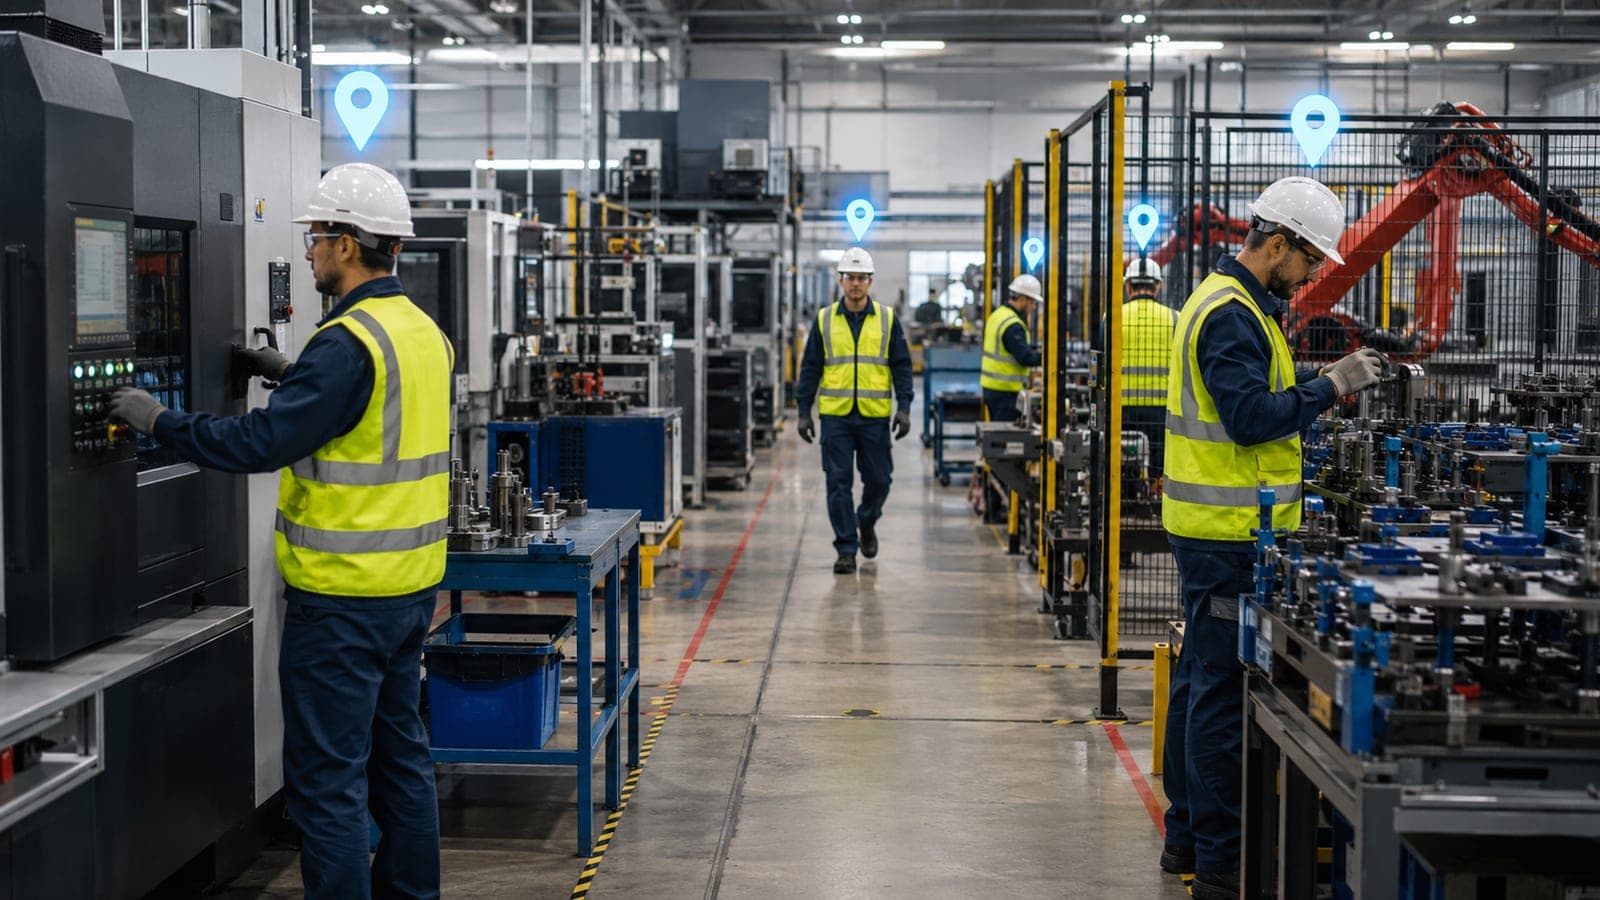
86%
In productive areas · trending up
How we work
Assessment and zone mapping
We define with you the areas that matter (productive, support, restricted) and the shifts, to size the solution and expected value.
Map go-live
We set up the zone detection points and build the digital twin with generic labels, no personal names.
Capacity and compliance rules
We configure maximum capacities, restricted zones and the rules whose breach should trigger an alert, to match your operation.
Dashboards and training
We leave the productive-time, path and presence dashboards ready, and train your team to run from day one.
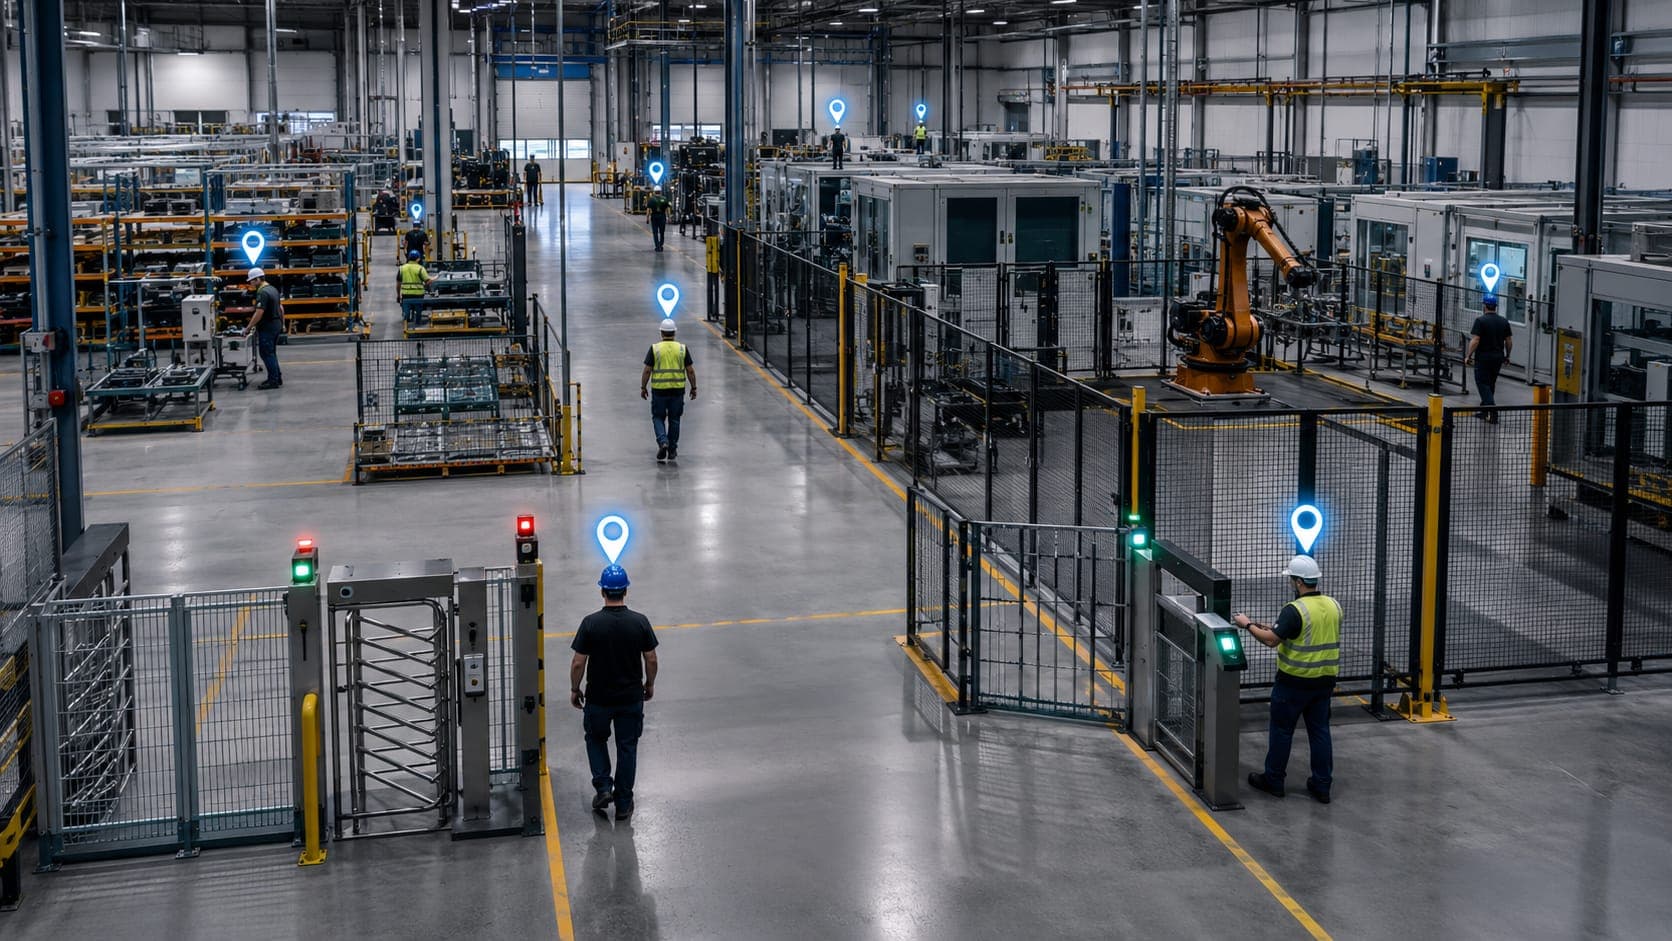
Where it has the greatest impact
Manufacturing plants
Measure how much time is spent in productive areas per shift and control capacity in process zones, with an automatic alert if someone enters a restricted area.
Labs and regulated areas
Compliance for access to controlled zones with per-area evidence, without naming people, to sustain protocols and audits.
Warehouses and distribution centers
Visibility of time in operational zones and capacity control in high-value areas, to balance safety and efficiency.
Multi-shift operations
Compare % in productive areas across shifts and days to see where the operation flows best and replicate what works.
FAQ
Frequently asked questions
No. PRESENCE doesn't watch people: it measures, by zone, how much of the time the operation happens in productive areas and alerts only when a rule breaks, such as capacity exceeded or access to a restricted zone. The focus is productive time, safety and compliance, not individual tracking.
Presence is shown as a map or digital twin with generic area labels (Entrance, Area 1, Lab, Production, Offices), not as a list of flagged individuals. Dashboards work at the zone and shift level, with access controls on the information.
It's the hero indicator: what share of the shift's time is spent in the zones where value is created, versus transit or support areas. You see it by day and by shift to understand trends, always at the operation level and not the person level.
You define each area's maximum capacity and which zones are restricted; the system alerts only when one of those rules breaks. That way attention arrives only when something requires it, with no noise or constant manual monitoring.
Yes. PRESENCE is part of the Lyna platform and integrates with the rest of the solutions and with the AI layer to give context to presence data within the full operation, from a single source of truth.
Keep learning
Turn presence into productive time
Request a free assessment and see how much productive time, compliance and safety you can gain with a live map of your operation, with no manual watching.